With over 6,000 post-secondary institutions and a wide universe of student housing investment opportunities in the U.S., Blue Vista believes that thoughtful and targeted market selection is necessary for successful investment in the sector.
Key Takeaways
 Blue Vista estimates that the institutional student housing investable universe consists of roughly 175 top schools with sufficient demand to support private student housing at meaningful scale.
- In Blue Vista’s view, industry performance is resilient but can be highly market dependent – each school is its own micro-market.
- Blue Vista’s approach to student housing investments pulls from 20 years of investing in the sector to create targeted investment criteria that fosters sustained operational excellence.
Blue Vista’s Top-Down University Market Selection Model
Today, many investors only desire to invest at the largest and most well-known “Power 4” universities (those that compete in the SEC, Big Ten, Big 12, and ACC athletic conferences), which total fewer than 70 markets. This is generally driven by those markets’ outsized enrollment growth and historical liquidity. While this rifle shot strategy can be successful, Blue Vis
ta takes a more data-driven approach to the student housing market, seeking out markets based on supply and demand fundamentals and performance in lieu of more arbitrary measures such as athletic conference ranking. While this approach often steers our activity towards Power 4 markets, it also leads us to consider alternative markets that are on equal or better footing. As a result, our approach has uncovered markets with higher going-in cap rates, greater operational upside, and longer runway for durable NOI growth.
Blue Vista’s top-down university selection model filters the total market into 175 universities which meet the minimum size criteria of 10,000 full time undergraduate students and 1,000 off campus beds. We then rank each market annually using 20 unique characteristics that help determine viability for investment. Based on our experience, Blue Vista believes that the best positioned markets exhibit specific criteria which are captured in our top-down market ranking tool, including:
- Stable or growing enrollment
- Favorable retention rates (80%+) and graduation rates (65%+)
- High percentage of full time undergraduate students (75%+)
- A “school of first choice” for in-state students
- Stable or growing enrollment from out-of-state and international students
- Shortage of on campus housing and underserved
off-campus market
By compiling this data and ranking each market across these various criteria, we create a market landscape which guides our investment activity for the year. This framework is supplemented with an ongoing monitoring process, incorporating third-party data sources and customized AI agents to track real-time market information focused on:
-
- Preleasing rent growth, occupancy, and occupancy gains compared with the prior year
- New development proposals in each market
- Trends in university applications and enrollment
These continuous efforts allow us to identify emerging trends and potentially shift our investment focus to markets with higher near-term growth potential.
Blue Vista’s dynamic market selection process includes the following:
-
- A curated list of criteria drawn upon 20 years of experience investing in the sector
- Broader research scope to include over 100 universities outside the “Power 4,” where cap rates tend to be higher and new supply is considerably lower
- Continuous monitoring of what we view as the most important market health indicators to enable shifts in target focus
Case Study: University of Missouri vs. Georgia Tech
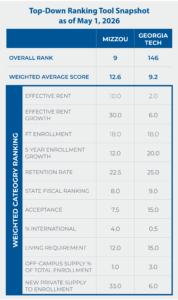
↗RISING: University of Missouri (Mizzou) has enjoyed a resurgence following a previous enrollment drop, which began in 2019 and lasted through 2021. In a period of renewed interest and stable enrollment, which hit 32,105 students for Fall 2025, the market has enjoyed near 100% occupancy for several years and ended the most recent lease-up with 11% rental rate growth. Additionally, the market has seen almost no new supply since 2017, which has created a favorable supply/demand story.
↘FALLING: Georgia Tech witnessed accelerated growth post-COVID, with full time enrollment surging by 20% (4,200 students) from 2020 to 2023. The tremendous growth coupled with no new on campus housing led to high occupancy and rising rental rates with 97% occupancy in Fall 2023 and two year rental rate growth totaling over 13%. Today, however, the market is suffering as enrollment growth slowed, a wave of new construction delivered, and competition from the conventional multifamily market applied pressure to the top end of the renter’s market. This combination of factors has caused a ripple effect of lowered rents and high concessions. Market occupancy now stands at 88% with year-over-year rental rate declines of 3.6%.
The snapshot on the right is from Blue Vista’s ranking tool with a focus on Mizzou and Georgia Tech. At this moment in time, Georgia Tech ranks well below Mizzou in Blue Vista’s model due to its current market softness but those conditions may shift over time.